- Hakkımızda
- Ürünler
-
-

INDUSTRIAL SOLUTIONS
Visit our dedicated infrared solutions website for more information on industrial infrared ovens and services.
-
-
-
- Bilgi ve Destek
-
-
-

Latest Blog
K 2019 in review
They had an enjoyable week hosting many visitors to the stand from all over the world. Of course, they no ... Devamını oku...K 2019 in review
-
-
- Nereden Alabilirim?
- İletişim
- Ceramicx Isıtma Çözümleri
- Hesabım/ Giriş / kayıt
- Sepet
Explanatory notes on Plancks Law
Home Information Media White papers Explanatory notes on Plancks Law
| AUTHOR | DATE CREATED | VERSION | DOCUMENT NUMBER |
|---|---|---|---|
| Dr. Gerard McGranaghan | 15 May 2015 | V1.1 | CC11 – 00065 |
Plancks Law describes the electromagnetic radiation emitted by a black body in thermal equilibrium at a definite temperature. It is named after Max Planck who proposed it in 1900.
Introduction
Plancks Law tells us that as the temperature of any emitting surface increases, more and more energy will be released as Infrared energy. The higher the object temperature, the greater the amount of infrared energy will be produced. As well as becoming more intense (Power) the emitted frequencies become wider and the peak wavelength becomes shorter. At very high temperatures not just infrared, but some shorter wavelength visible light will also be produced. This is first witnessed as a dull red glow, then to orange, yellow and finally white. Figure 1 shows typical Planck curves for a range of temperatures that have been plotted from 1050°C to 50°C.
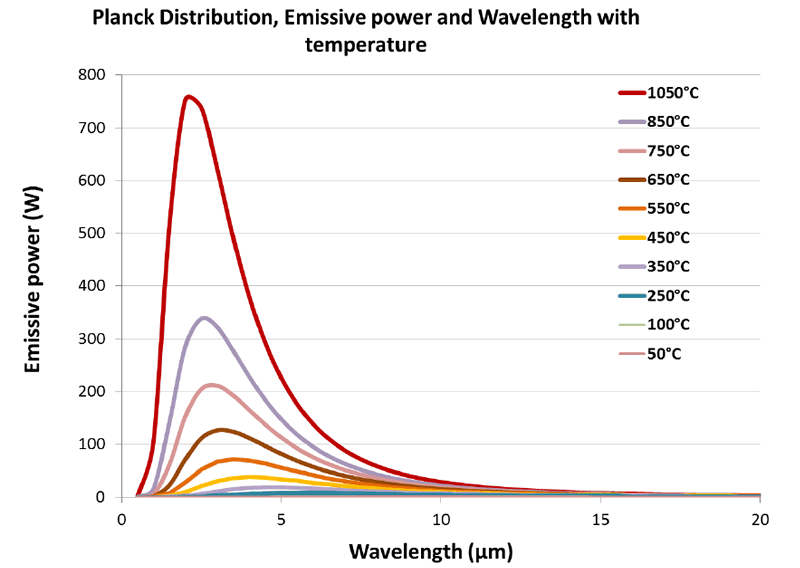
The red curve corresponding to 1050°C exhibits the strongest output. It shows the highest power output and its peak is at around 2.5 microns. This is followed by the curve at 850°C where the peak energy is less than half of that produced at 1150°C. As the temperature decreases, the energy levels also drop, and the peak energy wavelength shifts to the longer wavelengths. The lowest temperatures from the 250°C, 100°C and 50°C curves cannot be seen in the graph.
When the graph is enlarged to see the lower temperature curves, this shift to the longer wavelengths is more apparent. However the power intensity drops significantly.
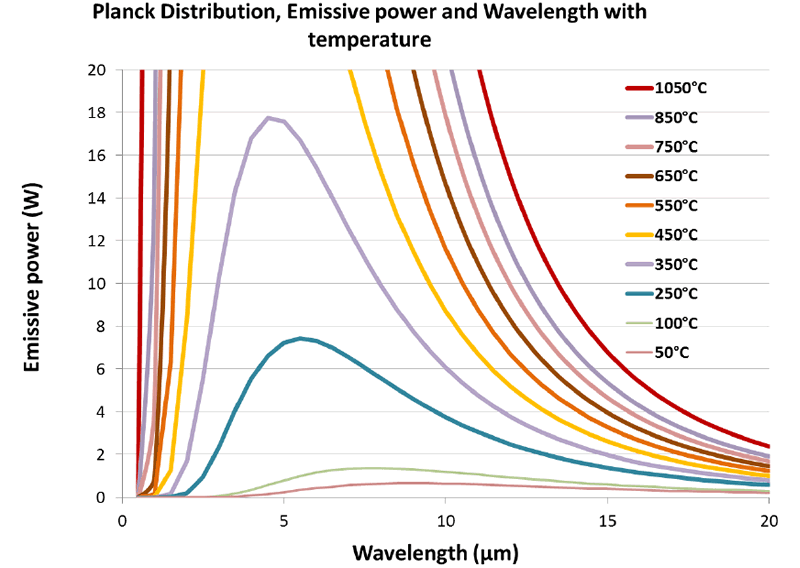
This is shown in Figure 2. At 250°C the blue curve can be seen to have an approximate peak around 6 microns, whereas at 100°C the peak wavelength is around 7.5 microns. Note also that the extent of wavelength is more evenly distributed and doesn’t exhibit the concentrated narrow peak seen at higher temperatures.
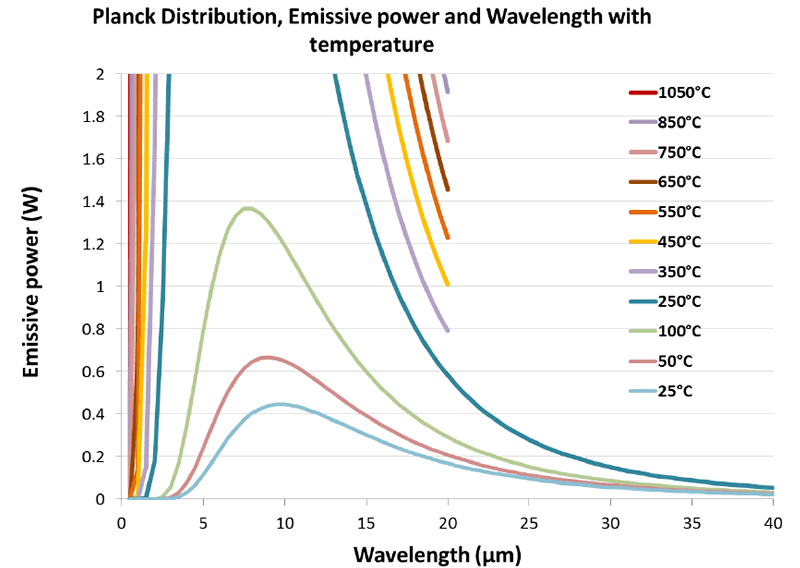
If we enlarge the same graph again and focus only on the lower temperatures as shown in Figure 3 we see that temperatures of 50°C and 25°C have peak wavelengths of around 9 and 10 microns respectively.
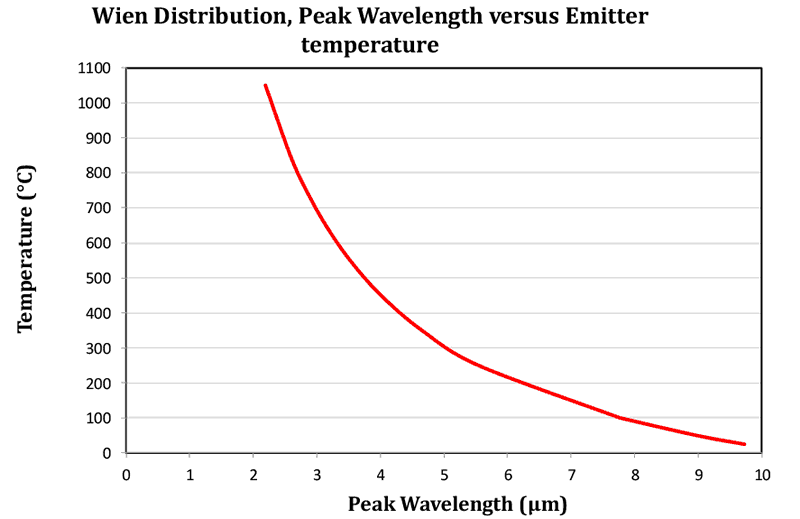
In the final graph shown in Figure 4, a curve showing the peak wavelength against temperature is shown. This is plotted from Wiens Law. The increase in peak wavelength as temperature drops is clearly seen.
Summary
Plancks Law describes the electromagnetic radiation emitted by a black body in thermal equilibrium at a definite temperature. When plotted for various heater (emitter) temperatures, the law predicts
- the range of frequencies across which infrared heating energy will be produced
- the emissive power for a given wavelength
When selecting an infrared emitter for a particular heating task, the target material absorption characteristics are of high importance. Ideally,the emitted infrared frequencies and the target material absorption frequencies should match to allow the most efficient heat transfer. However as can be seen from the previous graphs, at longer wavelengths, the amount of energy transferred will be lower due to the lower emitter temperatures, therefore heating times will usually take longer.
The shorter the wavelength, the higher the emitter temperature and the available infrared power increases rapidly.


